
Today I found such an interesting function called "density", this function computes kernel density estimates, that's why I found it pretty interesting, all you need is:
- the the data from which the estimate is to be computed
- the smoothing kernel to be used (This must be one of
"gaussian","rectangular","triangular","epanechnikov","biweight","cosine"or"optcosine", with default"gaussian", and may be abbreviated to a unique prefix -single letter.)
For example, I used some of the datasets included in R to use this function with different kernels, my first example was using the data set called 'UKgas', which contains the Quarterly UK gas consumption from 1960Q1 to 1986Q4, in millions of therms. The 1st image shows the histogram of given data set using a gaussian kernel, while the second image shows the same but using a rectangular kernel, where the diference between both estimations is obvious.
For the 2nd example I used a dataset called 'Treering', which contains normalized tree-ring widths in dimensionless units, here the 2nd image uses a gaussian kernel, and the image on the left uses a rectangular kernel, where the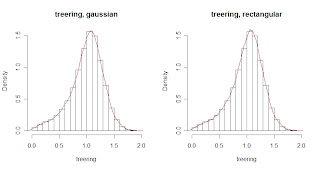 difference between both estimations again is obvious.
difference between both estimations again is obvious.Now, from the statistical point of view, if we type on R density(treering), we will get the next:
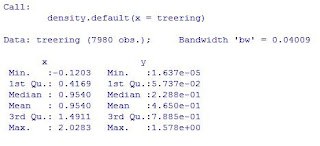
Which shows the basic statistics for the density estimation, another reason why I found this function pretty interesting and useful.
To finish with this post, I will add the code used for the examples, have a great day! :)
par(mfrow=c(1,2))
hist(treering,prob=1,breaks=20)
lines(density(treering,kernel="gaussian"),col=2)
hist(treering,prob=1,breaks=20)
lines(density(treering,kernel="rectangular"),col=2)
density(treering)
par(mfrow=c(1,2))
hist(UKgas,prob=1,breaks=20)
lines(density(UKgas,kernel="gaussian"),col=2)
hist(UKgas,prob=1,breaks=20)
lines(density(UKgas,kernel="rectangular"),col=2)


If you found density interesting then be sure to look at bkde2D in the KernSmooth package. Perspective and contour plots get you well beyond this limitations of correlation coefficients.
ReplyDeleteHello All.
ReplyDeleteSoftware Developer's Journal published a new issue fully dedicated to R language (250 pages).
You can read the teaser now: http://sdjournal.org/data-development-gems-software-developers-journal-teaser/
Do you know any R function for density estimation, using asymmetric kernels? May be Gamma kernel, for example.
ReplyDeleteThank you in advance for any information.
buenas noches cual es la funcion kernel que me proporcione el valor del estimador.este es la programacion en r
ReplyDelete###Estimador de kernell gaussiano
n<-20
set.seed(1999)
f<-numeric()
data<-rnorm(n)
x<-seq(from=-4,to=4,by=0.16)
fhat<-matrix(0,length(x),1)
h<-1.06*n^(-1/5)
for(i in 1:n){
f <- exp(-(1/(2*h^2))*(x-data[i])^2)/sqrt(2*pi)/h
plot(x,f/(n*h))
fhat<-fhat+f/n}
plot(x,fhat)
fhat[27]
pero deseo conocer la funcion que me simplifique toda esta programacion